Financial statements 2024
The John Nurminen Foundation 0895353-5
Consolidated Financial Statements 1 January 2024–31 December 2024
The John Nurminen Foundation
Consolidated Financial Statements
| Parent company | Parent company | Group | Group | ||
| ORDINARY OPERARTIONS | 1.1.2024-31.12.2024 | 1.1.2023-31.12.2023 | 1.1.2024-31.12.2024 | 1.1.2023-31.12.2023 | |
| MARITIME CULTURE | |||||
| Income | |||||
| Income from Group companies | 25 799,37 | 3 268,54 | 0 | 0 | |
| Targeted donations | 45 016,66 | 46 247,82 | 45 016,66 | 46 247,82 | |
| Grants received | 22 567,27 | 15 062,00 | 22 567,27 | 19 450,47 | |
| Other income | 979,41 | 1 378,07 | 133 255,30 | 87 459,64 | |
| Income, total | 94 362,71 | 65 956,43 | 200 839,23 | 153 157,93 | |
| Expenses | |||||
| Liabilities to Group companies | -1 010,62 | −116,31 | 0 | 0 | |
| Personnel expenses | -272 453,37 | -266 413,52 | -322 520,92 | -339 326,98 | |
| Depreciation and write-downs | −441,05 | −587,94 | -10 711,93 | -10 858,82 | |
| Other expenses | -285 018,06 | -454 423,68 | -403 522,88 | -574 240,64 | |
| Change in inventories | 385,54 | 43,59 | -59 772,16 | -1 669,11 | |
| Expenses, total | -558 537,56 | -721 497,86 | -796 527,89 | -926 095,55 | |
| MARITIME CULTURE, TOTAL | -464 174,85 | -655 541,43 | -595 688,66 | -772 937,62 | |
| MARINE ENVIRONMENT | |||||
| Income | |||||
| Targeted donations | 162 714,45 | 307 028,39 | 162 714,45 | 307 028,39 | |
| Grants received | 488 414,27 | 185 669,92 | 488 414,27 | 185 669,92 | |
| Other income | 8 790,00 | 1 050,00 | 8 790,00 | 1 050,00 | |
| Income, total | 659 918,72 | 493 748,31 | 659 918,72 | 493 748,31 | |
| Expenses | |||||
| Liabilities to Group companies | -3 433,14 | −518,8 | 0 | 0 | |
| Personnel expenses | -1 182 422,42 | -1 042 039,06 | -1 182 422,42 | -1 042 039,06 | |
| Depreciation and write-downs | -1 763,89 | -2 351,94 | -1 763,89 | -2 351,94 | |
| Other expenses | -1 115 003,46 | -994 020,46 | -1 115 003,46 | -994 539,26 | |
| Expenses, total | -2 302 622,91 | -2 038 930,26 | -2 299 189,77 | -2 038 930,26 | |
| MARINE ENVIRONMENT, TOTAL | -1 642 704,19 | -1 545 181,95 | -1 639 271,05 | -1 545 181,95 | |
| GENERAL EXPENSES | |||||
| Expenses | |||||
| Personnel expenses | -63 104,90 | -55 799,74 | -63 104,90 | -55 799,74 | |
| Other expenses | -27 574,94 | -14 523,11 | -27 574,94 | -14 523,11 | |
| GENERAL EXPENSES, TOTAL | -90 679,84 | -70 322,85 | -90 679,84 | -70 322,85 | |
| INCOME/DEFICIT FROM ORDINARY OPERATIONS | -2 197 558,88 | -2 271 046,23 | -2 325 639,55 | -2 388 442,42 | |
| FUNDRAISING | |||||
| Income | |||||
| Donations received | 2 966 990,36 | 2 954 755,97 | 2 966 990,36 | 2 954 755,97 | |
| Targeted donations | -207 731,11 | -353 276,21 | -207 731,11 | -353 276,21 | |
| Income, total | 2 759 259,25 | 2 601 479,76 | 2 759 259,25 | 2 601 479,76 | |
| Expenses | |||||
| Personnel expenses | -317 118,23 | -286 875,81 | -317 118,23 | -286 875,81 | |
| Other expenses | -468 953,80 | -647 108,76 | -468 953,80 | -647 108,76 | |
| Expenses, total | -786 072,03 | -933 984,57 | -786 072,03 | -933 984,57 | |
| INCOME/DEFICIT FROM FUNDRAISING ACTIVITIES | 1 973 187,22 | 1 667 495,19 | 1 973 187,22 | 1 667 495,19 | |
| INVESTMENT AND FINANCING ACTIVITIES | |||||
| Rental activities | |||||
| Rental income | 200 709,40 | 158 990,78 | 200 709,40 | 158 450,78 | |
| Rental expenses | -182 866,63 | -139 799,48 | -182 866,63 | -139 799,48 | |
| Rental activities, total | 17 842,77 | 19 191,30 | 17 842,77 | 18 651,30 | |
| Investment activities | |||||
| Income | 940 790,35 | 627 613,72 | 940 790,35 | 627 613,72 | |
| Expenses | -144 318,81 | -608 407,53 | -144 318,81 | -248 473,68 | |
| Investment activities, total | 796 471,54 | 19 206,19 | 796 471,54 | 379 140,04 | |
| INCOME/DEFICIT FROM INVESTMENT AND FINANCING ACTIVITIES | 814 314,31 | 38 397,49 | 814 314,31 | 397 791,34 | |
| RESULT FOR THE FINANCIAL YEAR | 589 942,65 | -565 153,55 | 461 861,98 | -323 155,89 | |
| YEAR-END ALLOCATIONS | |||||
| Fund transfers | 1 058 137,19 | 1 538 555,48 | 1 058 137,19 | 1 538 555,48 | |
| SURPLUS (DEFICIT) FOR THE FINANCIAL YEAR | 1 648 079,84 | 973 401,93 | 1 519 999,17 | 1 215 399,59 | |
John Nurminen Foundation
Balance Sheet 2024
| Balance sheet | Parent company | Parent company | Group | Group | ||
| ASSETS | 31.12.2024 | 31.12.2023 | 31.12.2024 | 31.12.2023 | ||
| NON-CURRENT ASSETS | ||||||
| Intangible assets | ||||||
| Other capitalised expenses | 0 | 0 | 10 270,87 | 20 541,75 | ||
| Intangible assets, total | 0 | 0 | 10 270,87 | 20 541,75 | ||
| Tangible assets | ||||||
| Machinery and equipment | 6 614,82 | 8 819,76 | 6 614,82 | 8 819,76 | ||
| Artworks | 218 893,91 | 218 893,91 | 218 893,91 | 218 893,91 | ||
| Maps, books and objects | 517 002,69 | 517 002,69 | 517 002,69 | 517 002,69 | ||
| Tangible assets, total | 742 511,42 | 744 716,36 | 742 511,42 | 744 716,36 | ||
| Investments | ||||||
| Holdings in Group companies | 110 000,00 | 110 000,00 | 0 | 0 | ||
| Holdings in associated companies | 1 | 1 | 1 | 0 | ||
| Other shares and holdings | 14 151 453,45 | 13 697 884,21 | 14 151 453,45 | 13 697 884,21 | ||
| Investments, total | 14 261 454,45 | 13 807 885,21 | 14 151 454,45 | 13 697 884,21 | ||
| NON-CURRENT ASSETS, TOTAL | 15 003 965,87 | 14 552 601,57 | 14 904 236,74 | 14 463 142,32 | ||
| CURRENT ASSETS | ||||||
| Inventories | ||||||
| Books in progress | 2 429,13 | 2 043,59 | 2 429,13 | 2 043,59 | ||
| Completed books | 0 | 0 | 43 020,70 | 103 179,40 | ||
| Inventories, total | 2 429,13 | 2 043,59 | 45 449,83 | 105 222,99 | ||
| Long-term receivables | ||||||
| Receivables from Group companies | 176 417,48 | 156 417,48 | 0 | 0 | ||
| Other receivables | 22 200,00 | 0 | 22 200,00 | 0 | ||
| Long-term receivables, total | 198 617,48 | 156 417,48 | 22 200,00 | 0 | ||
| Short-term receivables | ||||||
| Receivables from Group companies | 0 | 3 085,87 | 0 | 0 | ||
| Sales receivables | 345 653,83 | 39 260,87 | 351 745,16 | 49 429,78 | ||
| Other receivables | 46 535,75 | 348 527,56 | 47 360,88 | 351 165,84 | ||
| Prepayments and accrued income | 387 512,00 | 99 201,20 | 388 307,00 | 99 519,96 | ||
| Short-term receivables, total | 779 701,58 | 490 075,50 | 787 413,04 | 500 115,58 | ||
| Cash in hand and at banks | 175 506,67 | 592 611,21 | 211 601,81 | 666 931,31 | ||
| CURRENT ASSETS, TOTAL | 1 156 254,86 | 1 241 147,78 | 1 066 664,68 | 1 272 269,88 | ||
| ASSETS, TOTAL | 16 160 220,73 | 15 793 749,35 | 15 970 901,42 | 15 735 412,20 | ||
Signatures on the financial statements
The financial statements are signed electronically
Tommi Juusela, chair
Jukka Anteroinen
Emilie Gardberg
Seppo Knuuttila
Juha Nurminen
Kaisa Olkkonen
Markku Ollikainen
Kristian Pullola
Marja-Leena Rinkineva
Annamari Arrakoski-Engardt, CEO
Financial statements audit
The report on the audit carried out is issued on the date indicated by the electronic signature
Deloitte Oy, Marika Nevalainen KHT
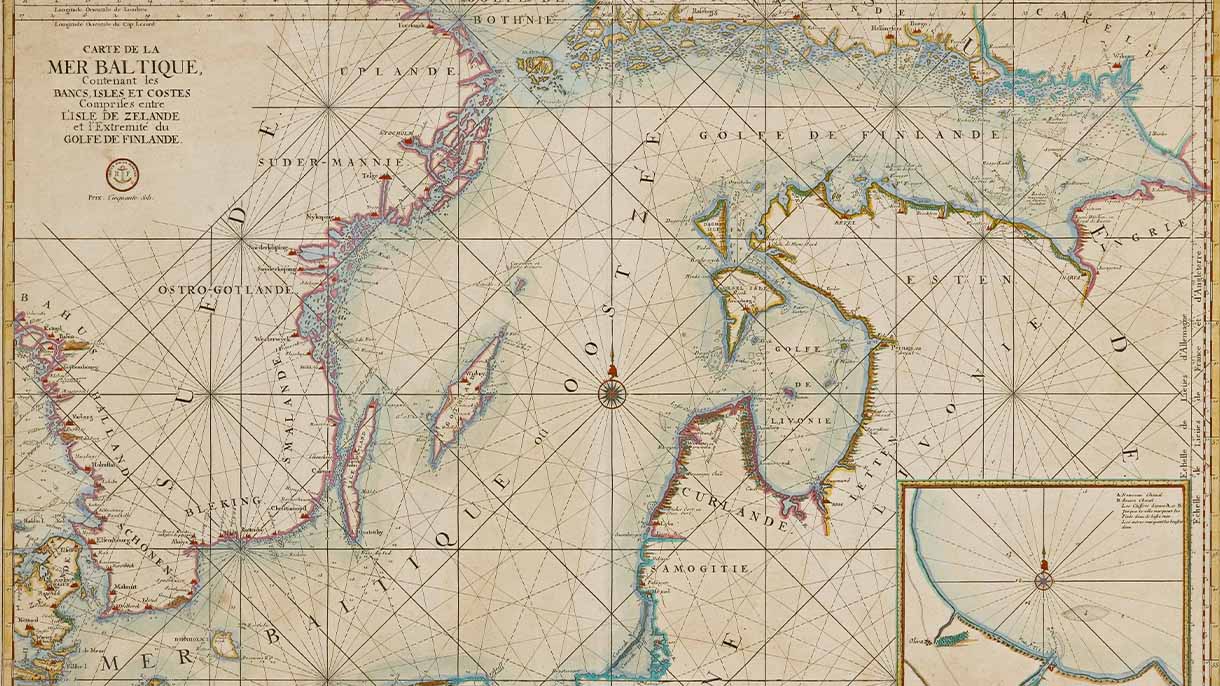
Photo: John Nurminen Foundation’s collections