The Atlases of the Baltic Sea virtual exhibition explores the history of seafaring – the details on sea charts tell stories of culture, trade, and power
More information

Maria Erkheikki
Publications and collections Manager maria.erkheikki@jnfoundation.fi +358 50 545 0481The Atlases of the Baltic Sea virtual exhibition offers a glimpse into the history of sea charts dating back centuries and highlights how navigation, trade, and the exercise of strategic power were intertwined on the waves of the Baltic Sea. The free exhibition features four sea atlases from the 17th 18th and 19th century.
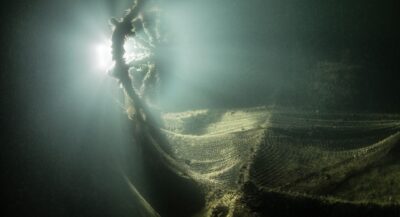
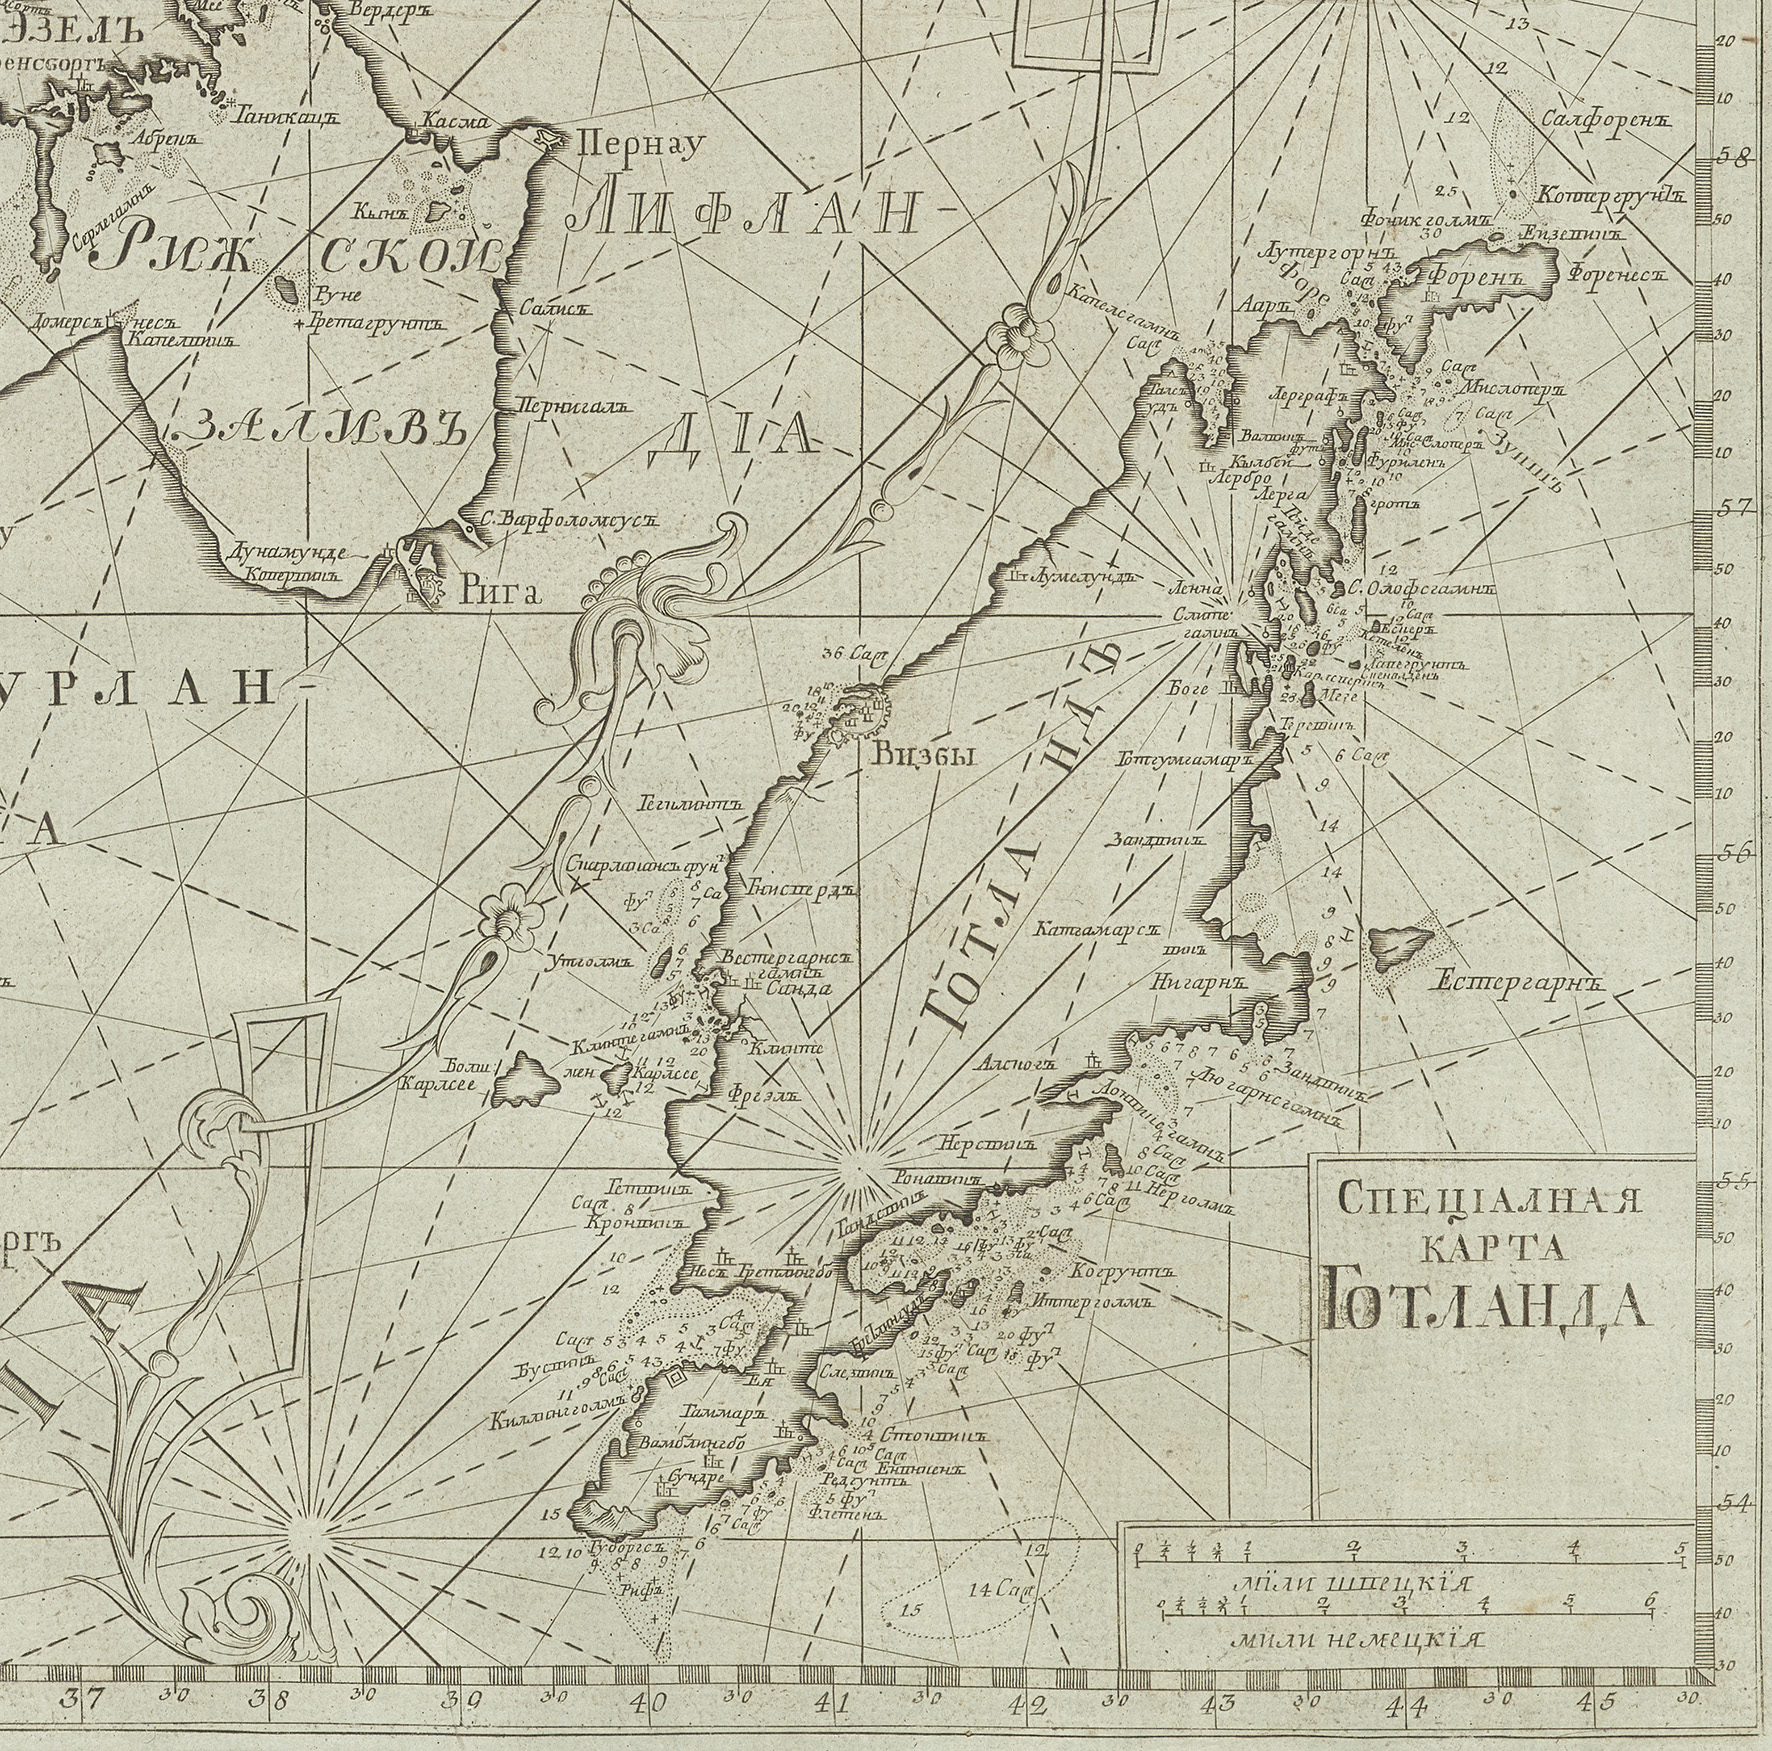
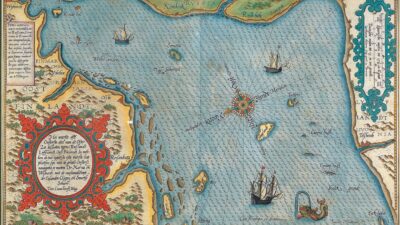
Seafarers have been sailing the Baltic Sea since the Viking Age, but sea charts to aid navigation were not drawn until the late 16th century. These became documents containing valuable navigational information that were therefore carefully protected.
The sea charts guided seafarers through narrow channels, warned of shoals, and helped them find the right port. At the same time, they conceal much more information within their pages.
“Historical sea charts are not merely navigational aids, but mirrors of their time. They reveal what was known about the seas, what was perhaps feared, and where people dared to sail. Sea charts combine a tapestry of science, art, and history, which makes them uniquely valuable,” says Maria Erkheikki, Publications and collections Manager at the John Nurminen Foundation.
A Strategic Weapon
The Atlases of the Baltic Sea exhibition demonstrates the immense strategic and military significance of old sea charts at a time when the sea was the fastest—and often the only—means of travel between major powers.
“Accurate sea charts enabled fleets to navigate narrow straits, fragmented archipelagos, and treacherous coastlines—and thus determined who controlled the sea routes and trade. The precise marking of ports and marketplaces revealed just how important maritime trade was to the Baltic Sea economy,” Erkheikki explains.
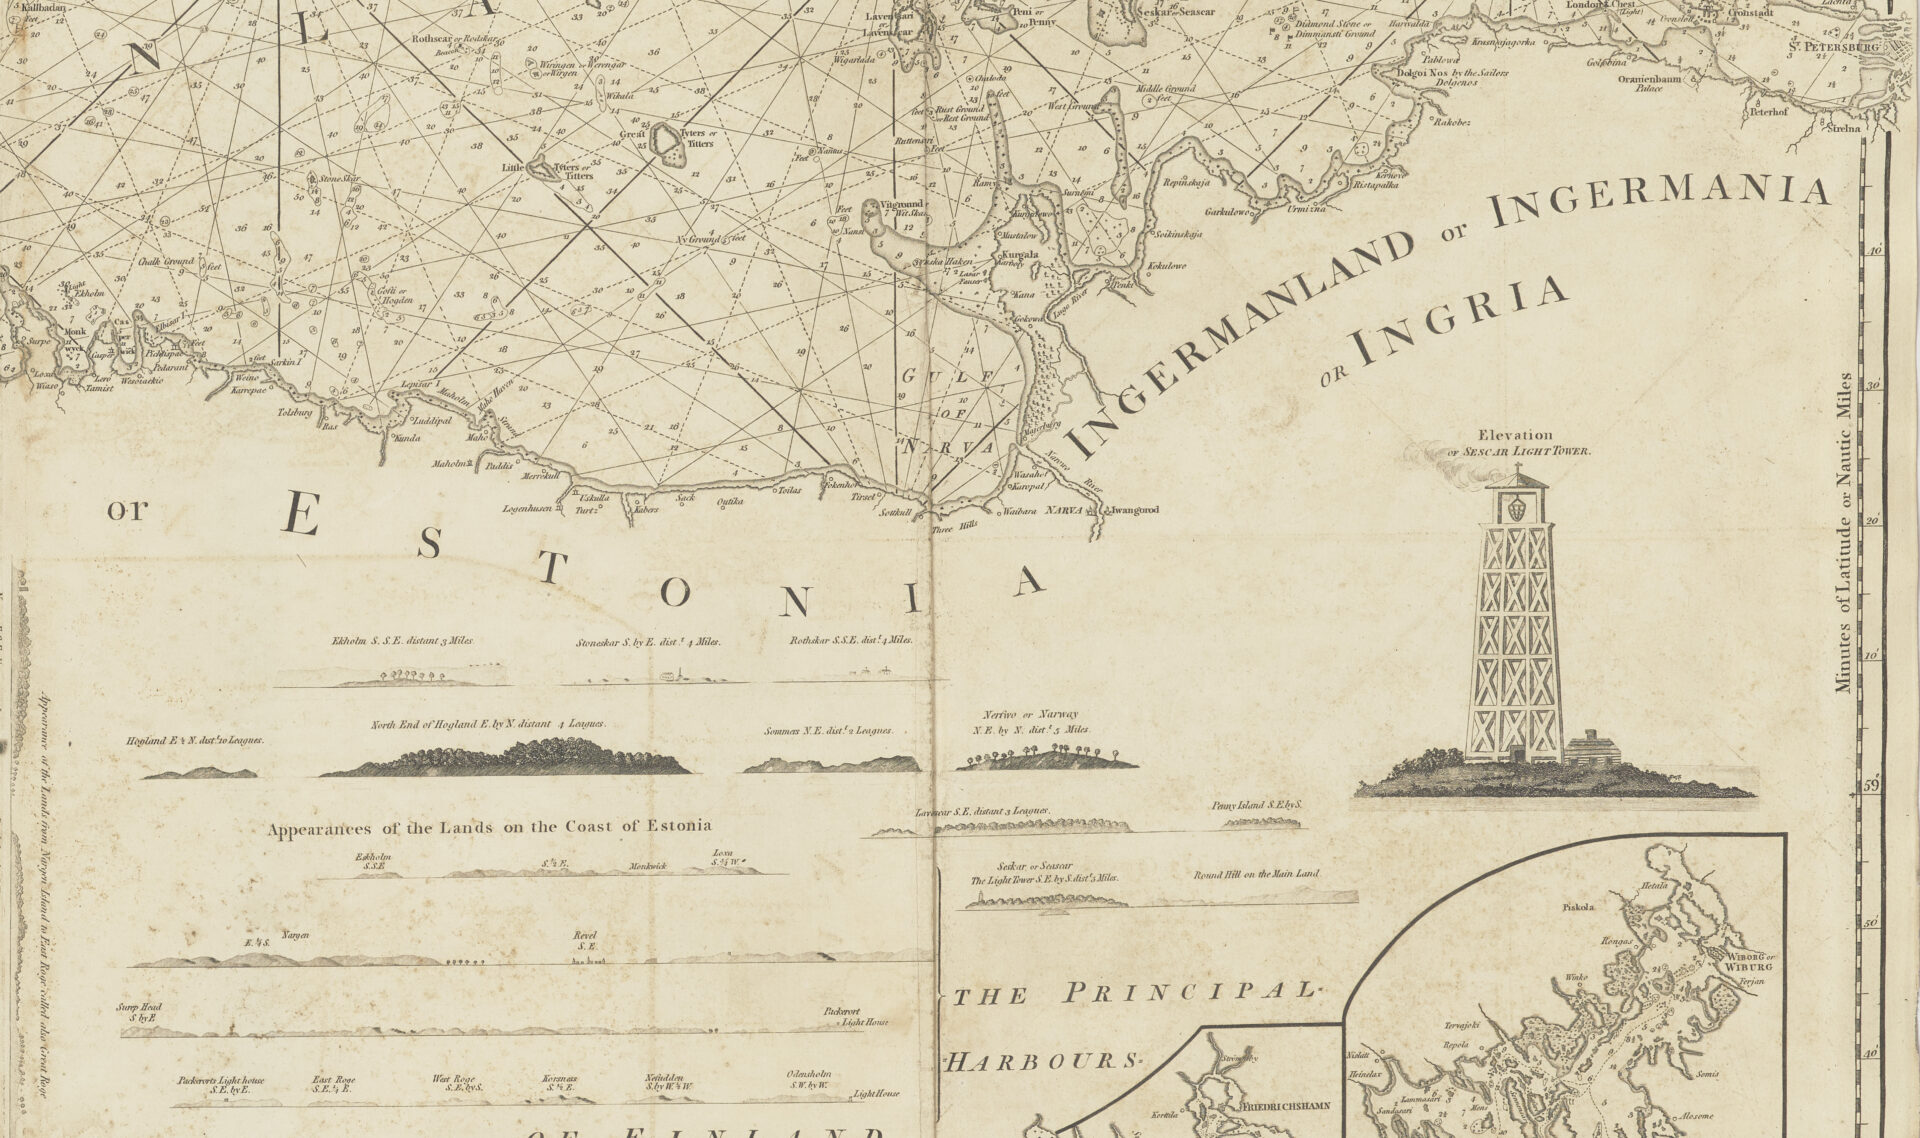
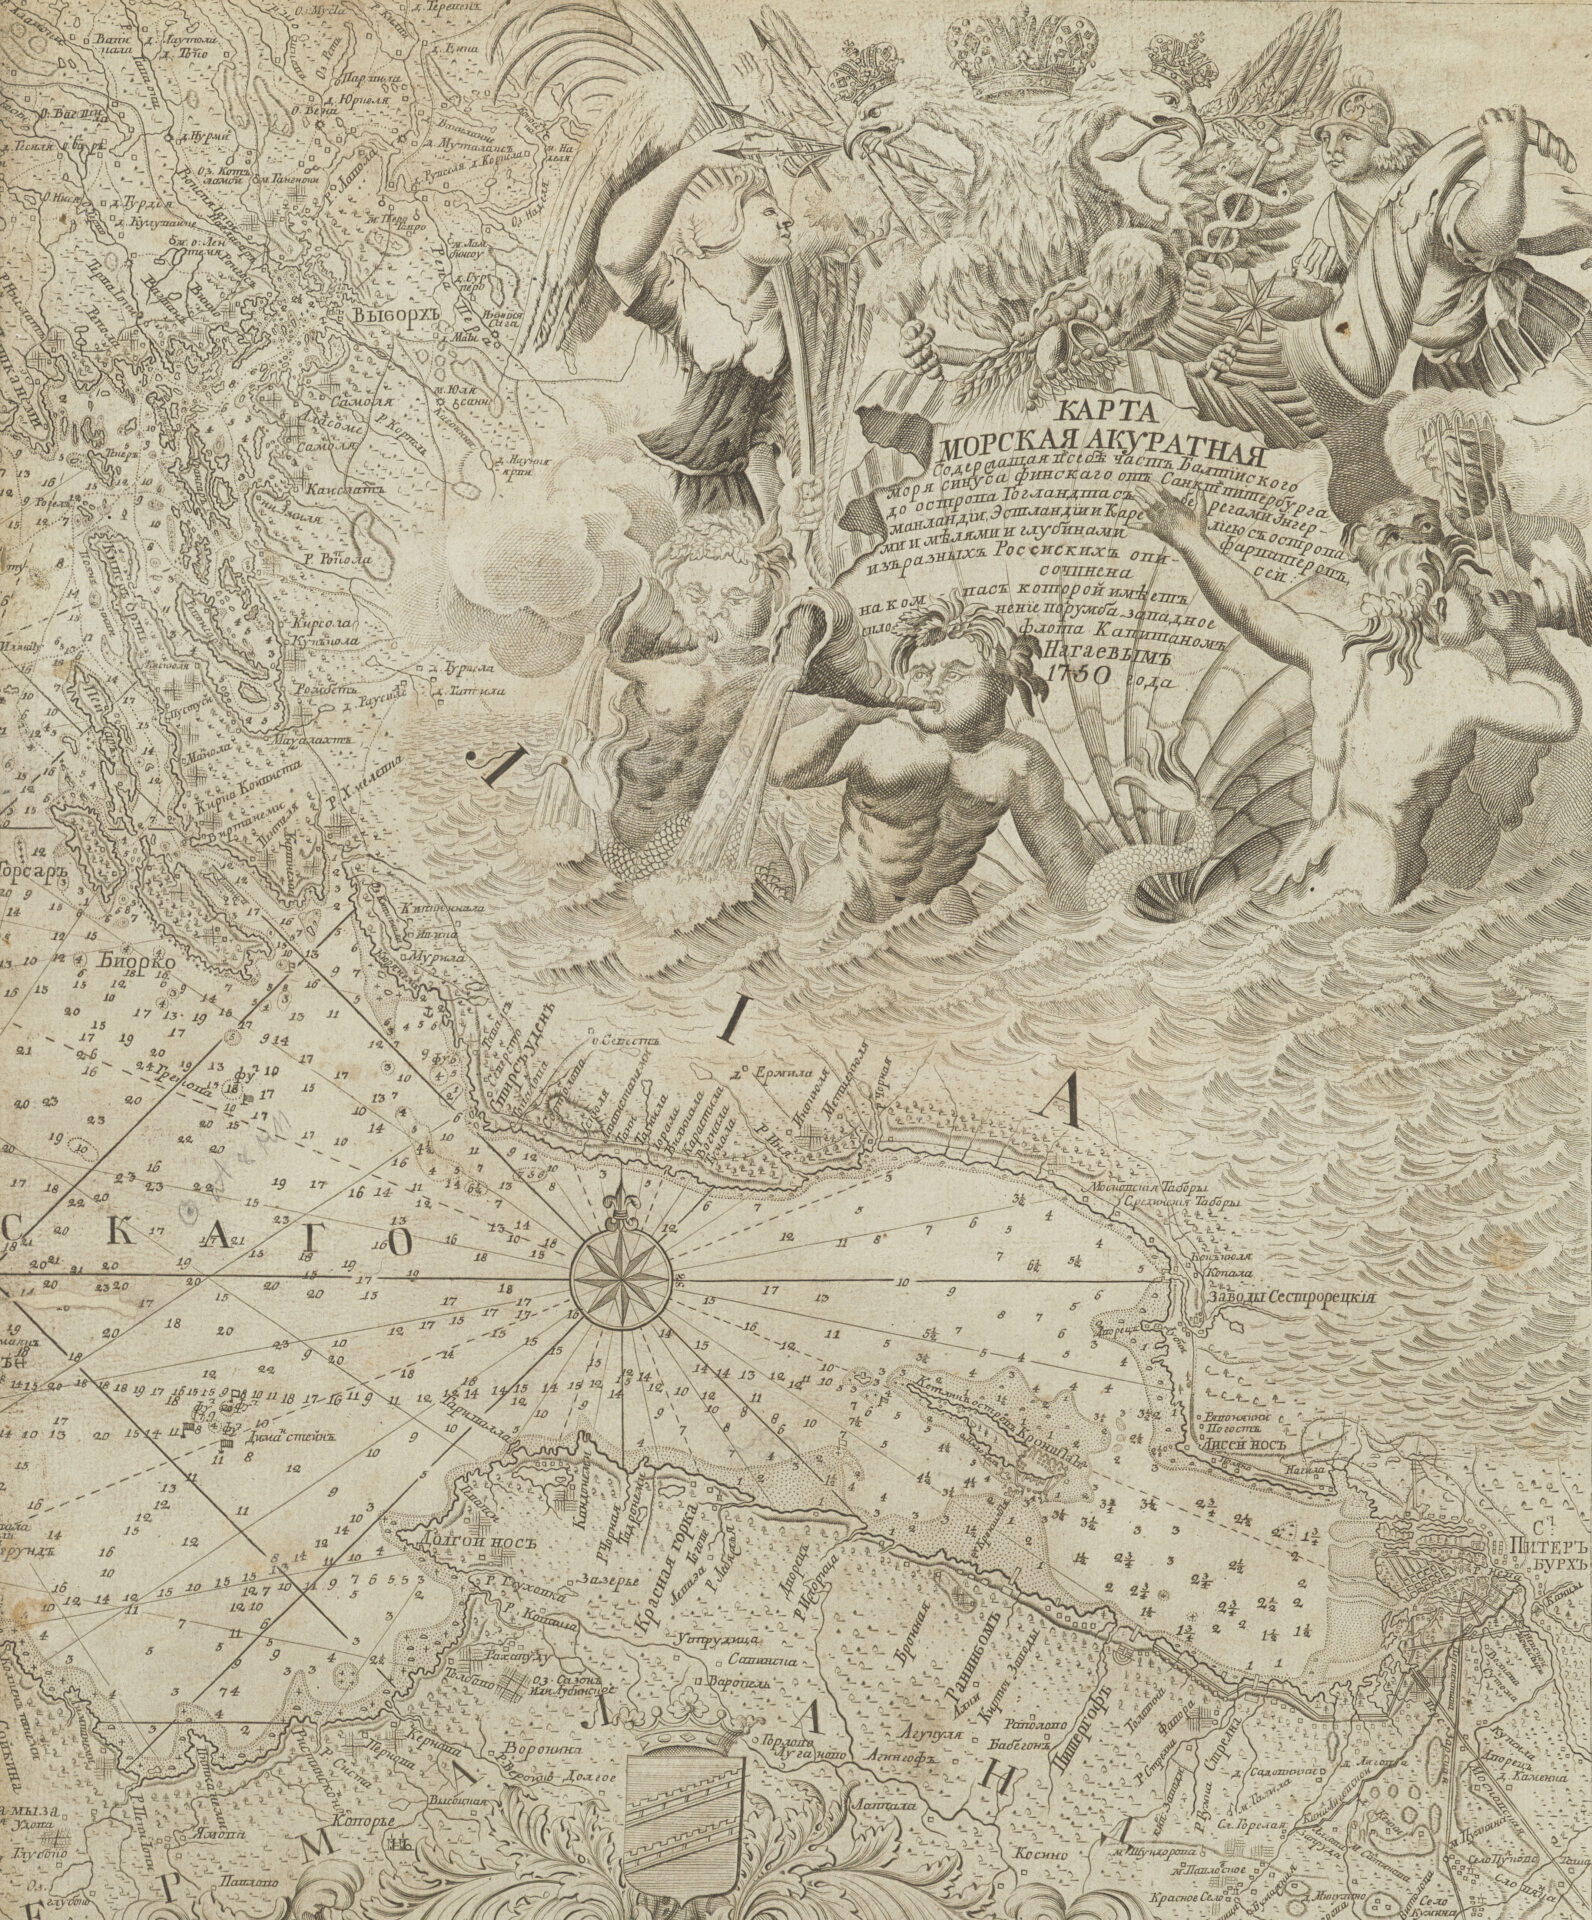
Sea charts also served as intelligence tools: Swedish, Russian, and British cartographies contained detailed markings of ports, fortresses, and waterways that could be exploited in military operations and sieges. Control over them signified the exercise of power: for example, the precise mapping of the Danish straits helped control access to the Baltic Sea, and Russian charts depicting the area around St. Petersburg demonstrated the imperial power’s effort to secure the new capital from the sea.
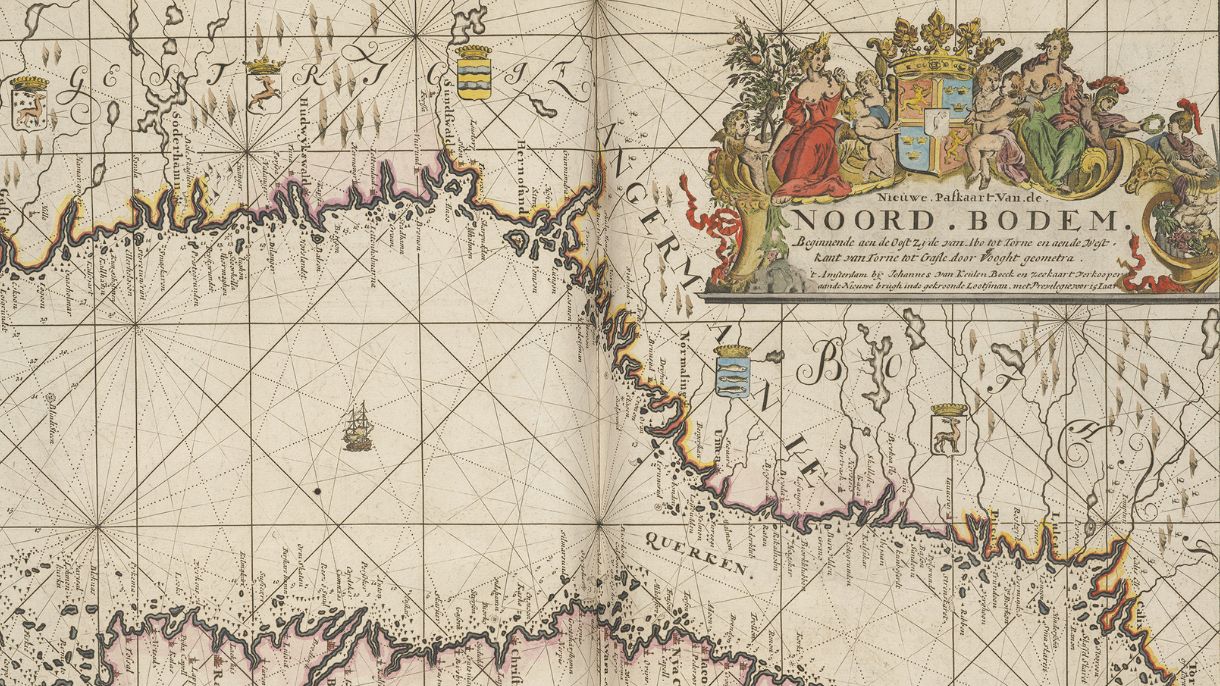
The John Nurminen Foundation’s maritime collection contains nearly a thousand old maps of the Baltic Sea and the northern regions, dating back as far as the 15th century. The most significant parts of the collection are eight atlases, some of which are on display in the virtual exhibition Atlases of the Baltic Sea. Atlases are collections of nautical charts bound in book form. The exhibition delves into the history of Swedish, Dutch, Russian, and English atlases.
The project will develop the digital usability of the Foundation’s collection, teach and test AI to improve accessibility of the collection and create new networks in the cultural field.
Haluatko pysyä kartalla Itämeren tilasta?
Tilaa uutiskirjeemme ja kuulet ensimmäisenä Itämeri-aiheisista tapahtumista, säätiön hankkeiden etenemisestä, merellisistä julkaisuista ja muista kiinnostavista sisällöistä.